Building in-App Reporting from 0 to 1 to boost SaaS platform's marketability
TL;DR I led the design and launch of an in-app reporting feature for a E2E SaaS platform, cutting a 4-step process to 1. In 9 months, I delivered key features like KPIs and tables, improving user experience and preventing a potential €0.5 million revenue loss while making the product more competitive.
Users
Innovation managers — employees within large enterprises responsible for running internal crowdsourcing initiatives. They launch and manage idea campaigns, monitor engagement, and report outcomes to senior leadership. Often this role is secondary to their primary job function, so they highly value speed and efficiency in the innovation management platform.
User problem
Innovation managers often need to assess campaign performance — like number of submitted ideas and other user activity KPIs.
Business problem
Innosabi lacked in-app reporting capabilities. In a competitive analysis with 50 providers, we lost a major client, finishing second due to this missing feature.
Sales estimated we could lose up to €0.5 million in annual contract value (ACV) if we didn’t deliver reporting by 2025.
Delivered solution
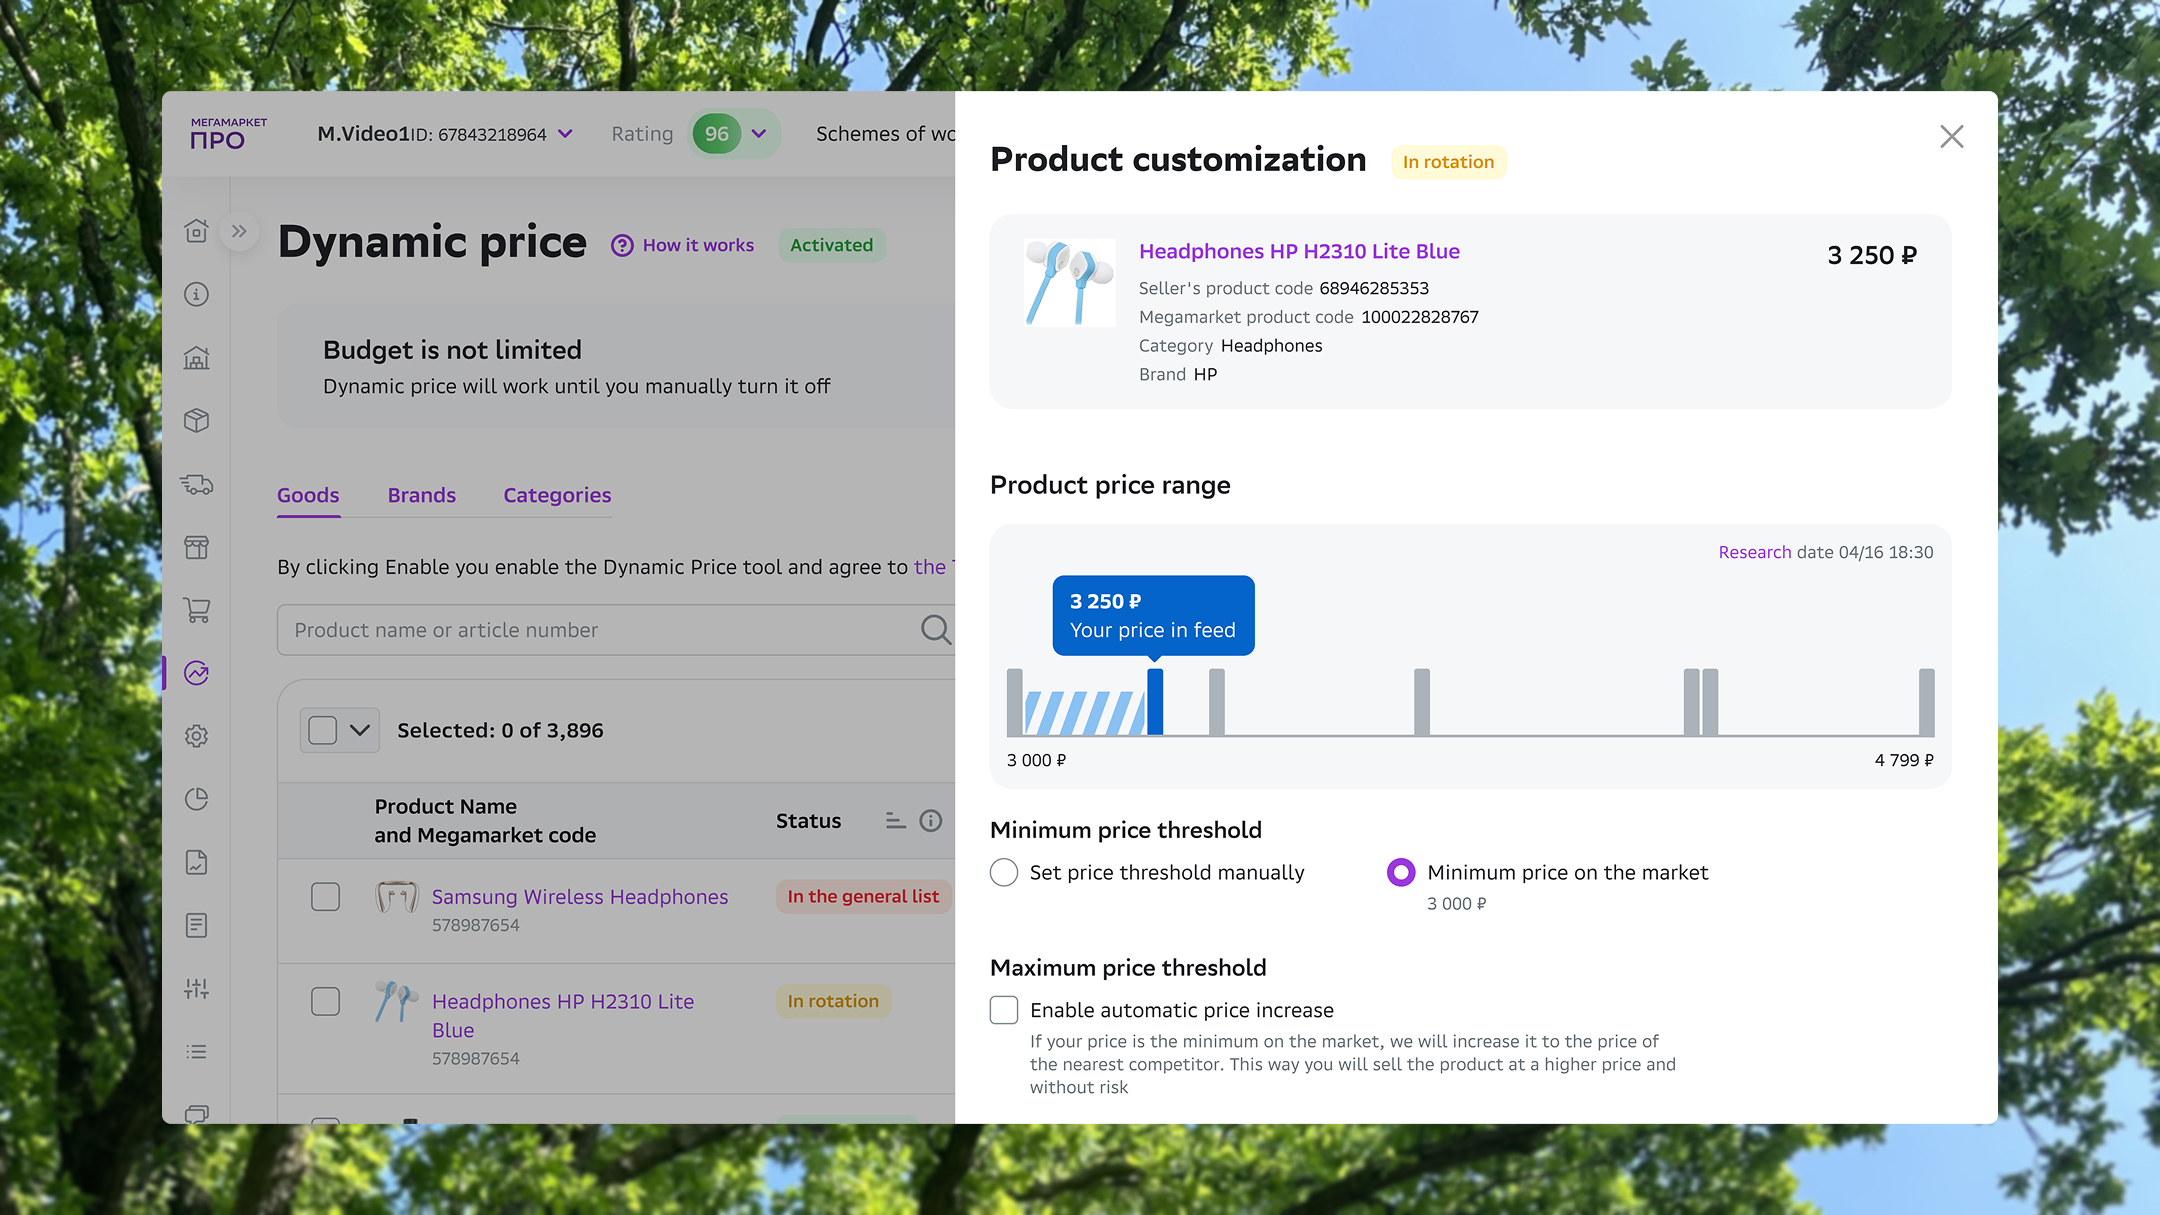
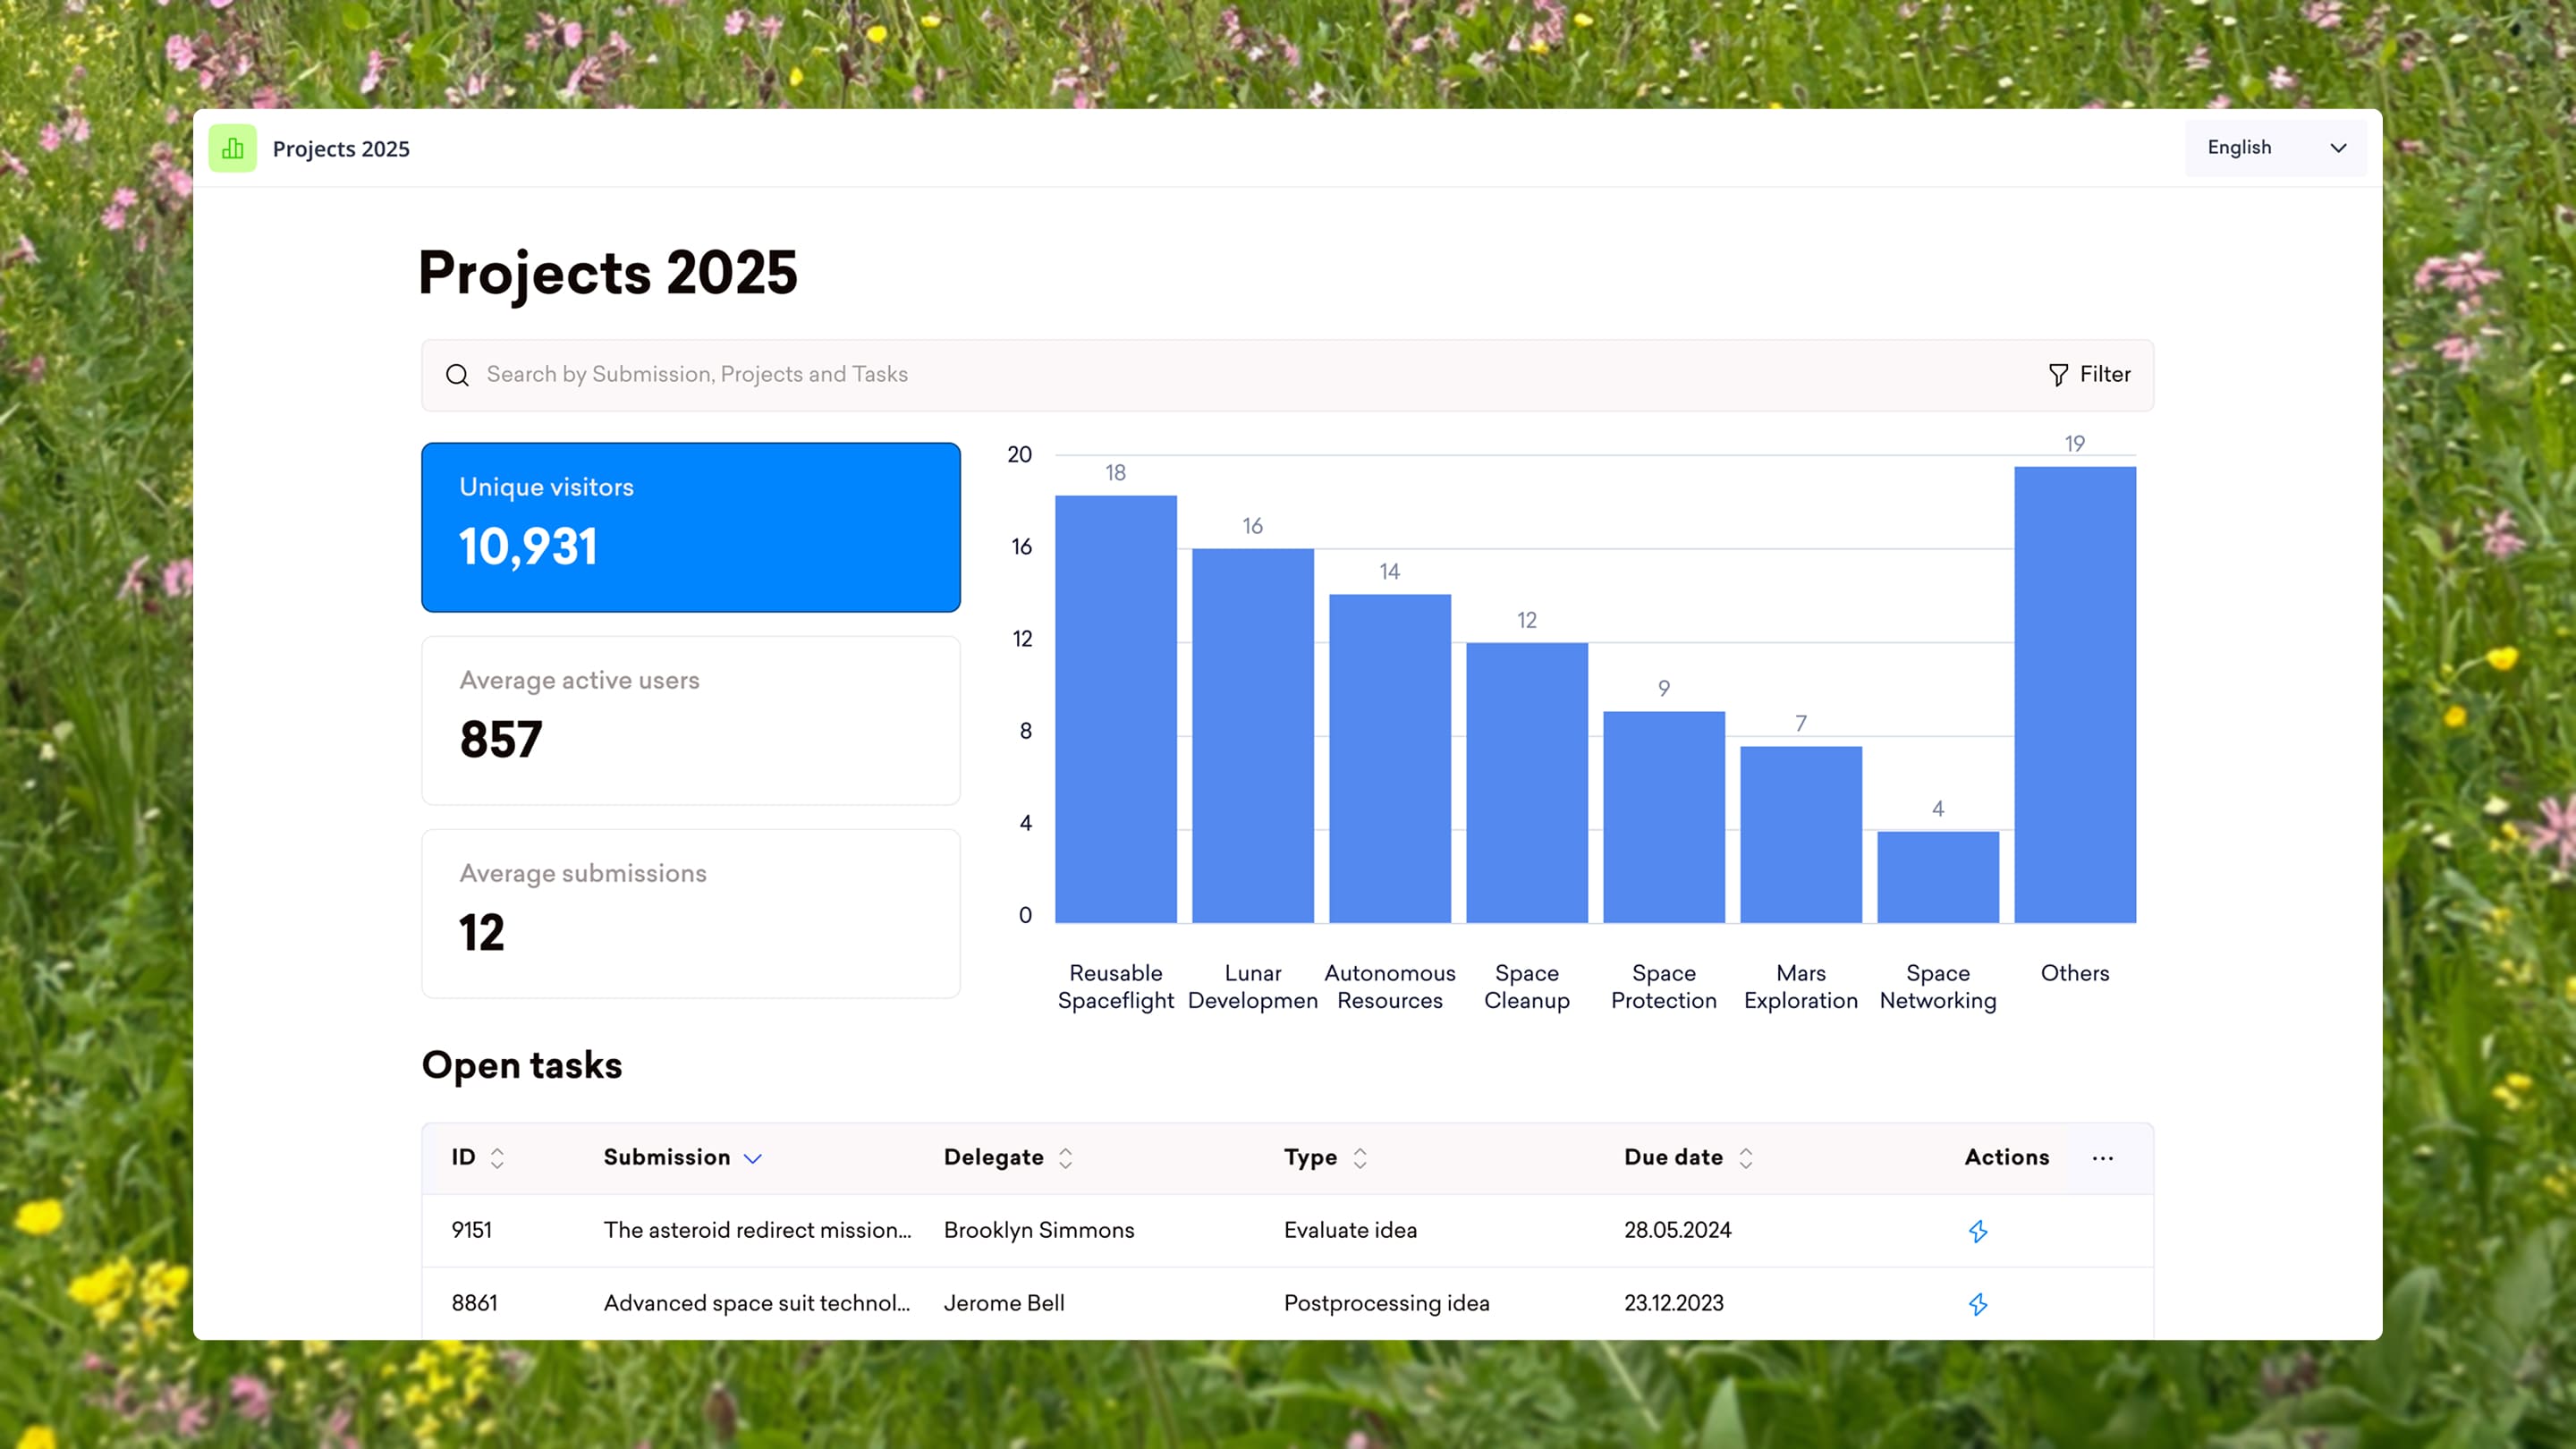
We implemented in-app reporting using our modular page-builder for maximum flexibility. Key features included:
- 3 New Widgets. KPI, Table and Filter+Search bar, designed with consistent visual patterns to enhance usability.
- Data Sharing. Users can publish dashboards platform-wide, boosting transparency and engagement by sharing campaign insights.
- Security by default. Different user groups can access data according to their rights. Admin can choose to disclose more information on a widget level
- Seamless Data Integration. We overhauled the backend to ensure smooth data fetching and a flawless user experience.
Key achievements
- Delivered in-app analytics and reporting from brief to MVP in 9 months.
- Managed a creation of a scalable data architecture, allowing new data sources to be added in minutes.
Constraints and Trade-offs
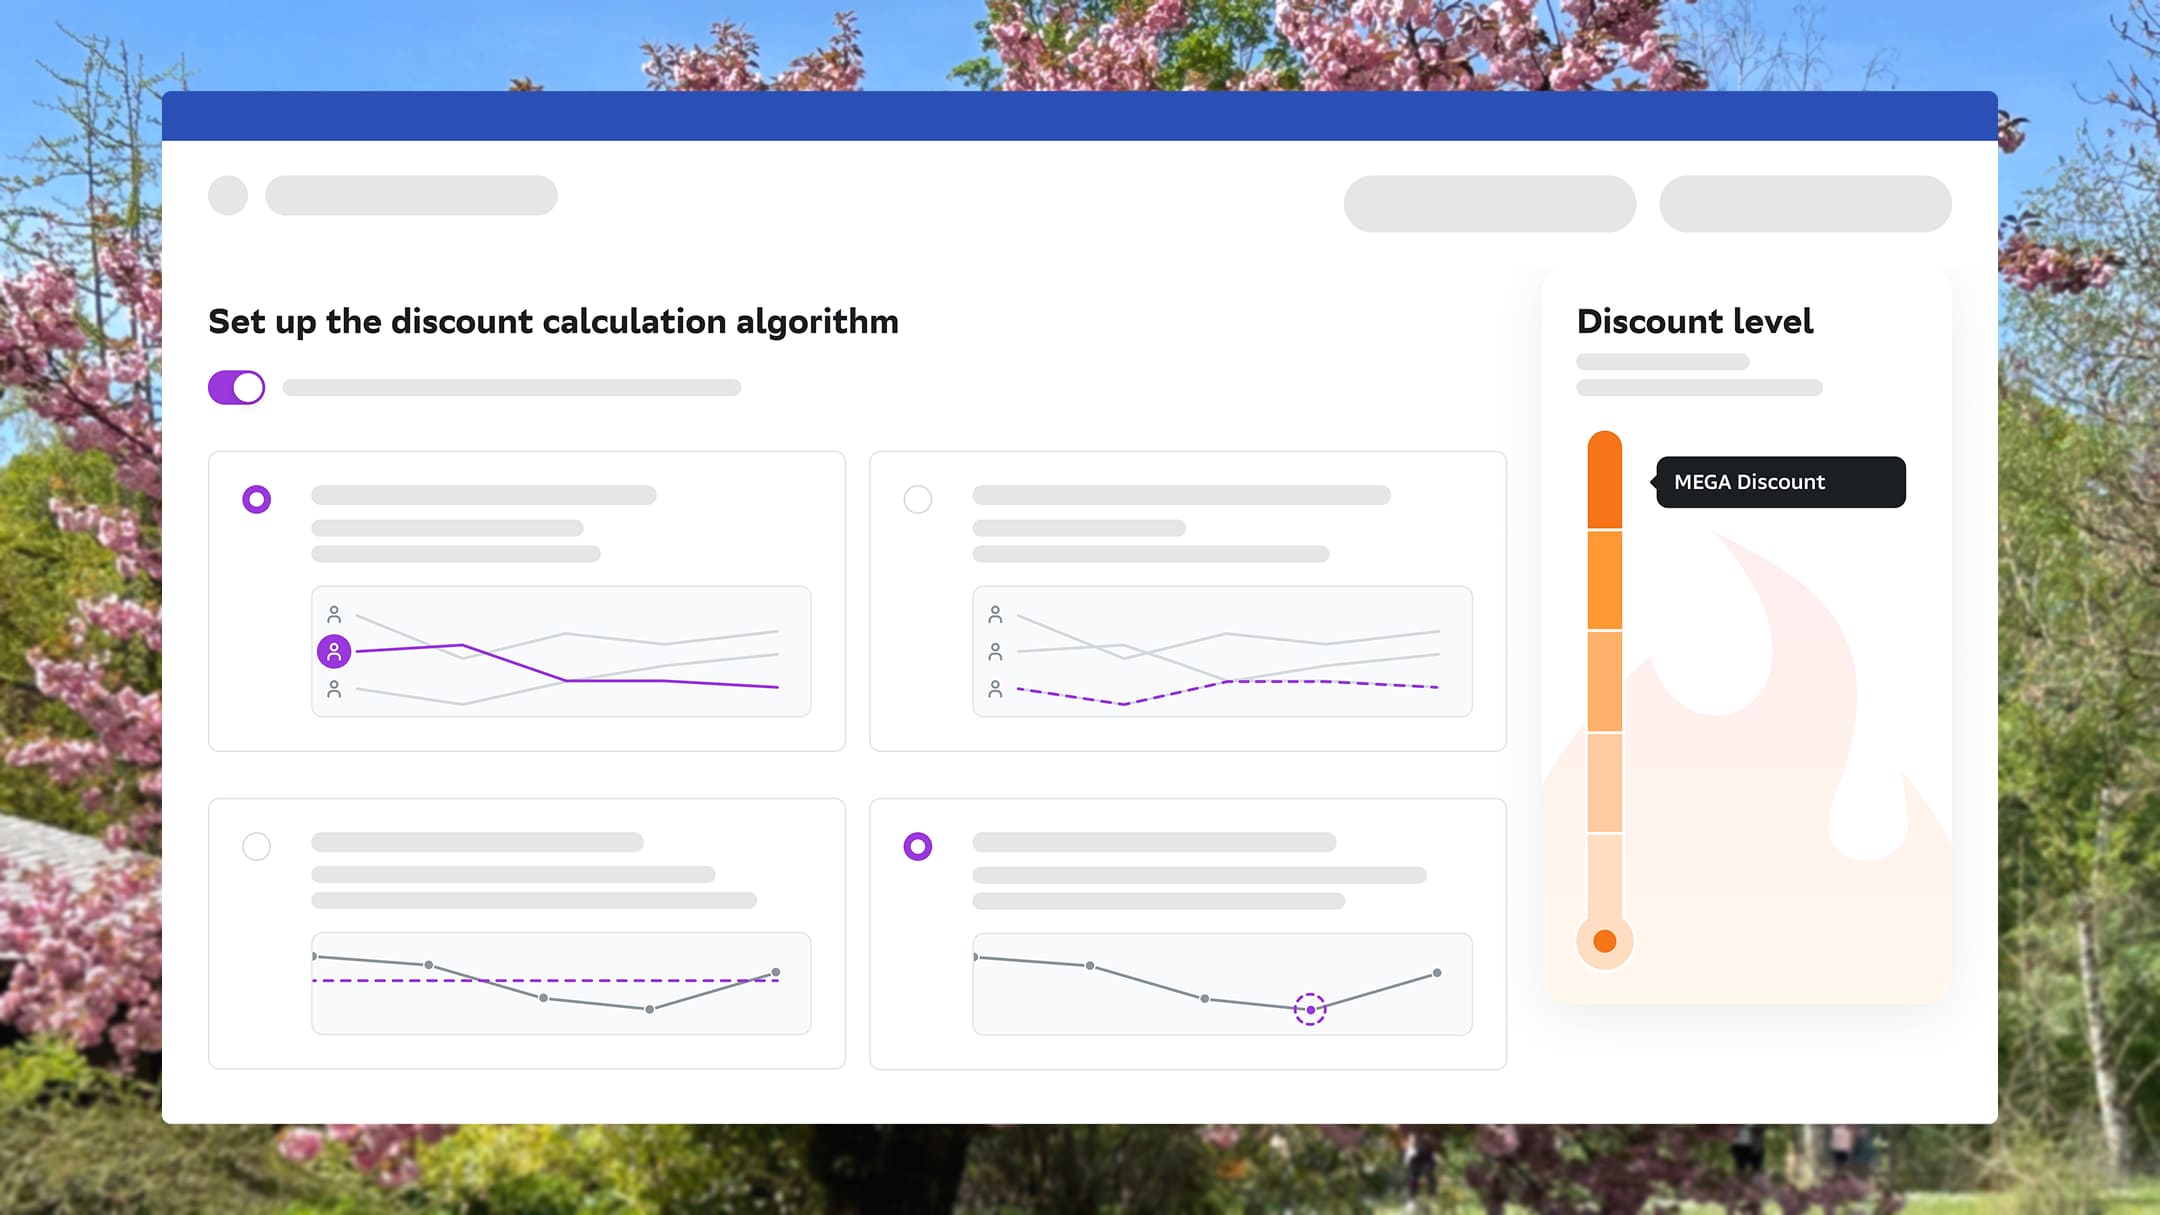
- A key trade-off I faced: either prioritize a variety of chart types or focus on delivering 2 critical widgets (KPIs and tables) with enhanced data sources. After consulting stakeholders, I chose the latter.
- Initially, access to reporting widgets was restricted to admins for security, with plans to implement a more flexible model later. We also prioritized widget and data delivery over fixing a buggy export feature, which would have delayed the project.
My role
I led the project from start to finish, including:
- Research. Conducted stakeholder interviews, competitive analysis, and benchmarking.
- Roadmapping. Developed and updated the roadmap in coordination with stakeholders.
- Design. Created user stories, prototypes, and UX copywriting.
- Dev Handover. Defined design tasks with clear acceptance criteria and supported implementation.
- Stakeholder Management. Facilitated bi-weekly meetings with a co-sponsoring client, presenting progress and future plans.
I worked with wonderful CPO Moritz Sebastian Wurfbaum and our development team.
Future plans
While some functionality is yet to be delivered, we’ve laid a solid foundation for rapid scaling and further development.
Here is a snippet of designed features for upcoming iterations